


Resources
US Defensive Equities Starting to Look Good Value
Promoted by ETF Securities.
This article looks at opportunities in defensive U.S. equities and shows how it may be a good entry point for ZYUS, which underperformed the broader market in 2017, but has picked-up in recent months and had standout performance in 2016.
US Defensive Equities Starting to Look Good Value

Promoted by ETF Securities.
This article looks at opportunities in defensive U.S. equities and shows how it may be a good entry point for ZYUS, which underperformed the broader market in 2017, but has picked-up in recent months and had standout performance in 2016.

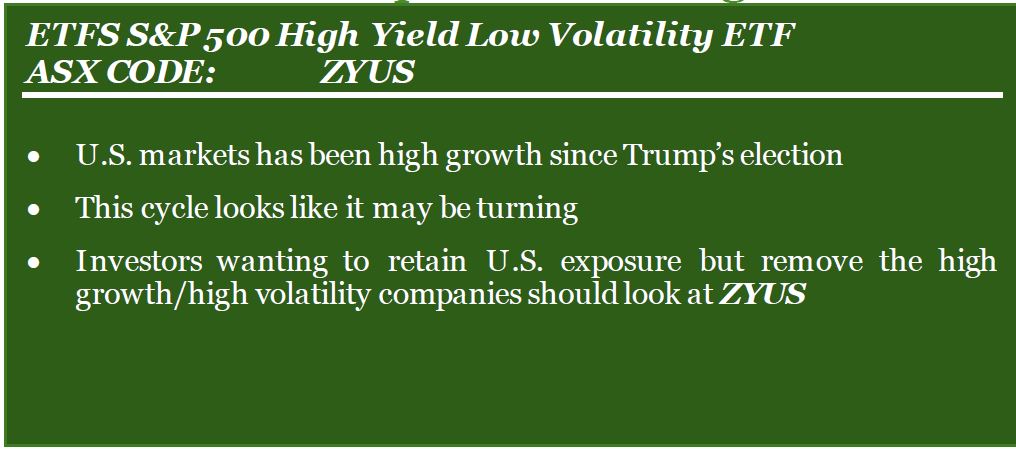
In this week’s ETFS Trade idea, we look at opportunities in defensive U.S. equities and show how it may be a good entry point for ZYUS, which underperformed the broader market in 2017, but has picked-up in recent months and had standout performance in 2016. ZYUS tracks the S&P 500 Low Volatility High Dividend Index, which selects a portfolio of the lowest volatility stocks from amongst the highest yielding names in the S&P 500.
The story in 2017 - defensives appeared to be out of favour
For most of 2017 the U.S. economy was in expansionary territory with GDP growth rising above 4%, the S&P 500 returning 22%, volatility remaining persistently low and normalisation of monetary policy accelerating. Information technology stocks dominated, returning 39%, but other traditional growth sectors also outperformed. Materials, consumer discretionary and financials all beat the benchmark.

Defensive sectors, which traditionally include utilities, consumer staples, health care and real estate, on the other hand, suffered on two fronts. Firstly, the economic conditions of a growing economy and rising interest rates were not conducive to above-market performance in sectors such as utilities, consumer staples and telecommunications. Secondly, many companies in these sectors had become over-bought and over-valued in the post-crisis scramble for stable returns and yield, where low volatility and equity-yield strategies gained significant popularity. With rates rising and bonds starting to look more attractive, asset allocations shifted causing under-performance in defensives in 2017 and into early 2018.
What has happened so far in 2018?
2018-to-date has seen the U.S. move further into expansionary territory, with GDP growth now sitting at 4.7% and the Federal Reserve having raised rates twice so far. However, signs of the expansionary cycle moving into a later phase have started to appear in recent months. Long-term bond yields have stabilised, inflation has picked-up and the S&P 500 has returned only 2.6% year-to-date. In addition, through a combination of geo-political and economic events, volatility has returned, with the VIX peaking at 37.3 in February and averaging 16.3 in 2018 compared to a maximum of 16.0 and an average of 11.1 for the whole of 2017.
Defensives are currently looking more attractive on a valuations basis than at any time in recent years. On a relative-PE basis, utilities, consumer staples, telecommunications and health care sectors are all currently trading at lower multiples than the S&P 500.
Even if the bull market still has further to run, now could be a good opportunity to re-allocate back towards defensive sectors. While the economy is not yet showing any signs of slowing, if you believe the U.S. is currently in a late-cycle boom, then it may be prudent to prepare for a sell-off in risky-assets.
How does ZYUS’s sector allocation look?
As can be seen in Chart 1, ZYUS is currently most overweight real estate and utilities along with smaller over-allocations to consumer staples, energy and telecoms. Information technology, health care and financials are the biggest under-weights. Overall, relative to the S&P 500, ZYUS is 34% overweight to the traditional defensive sectors,
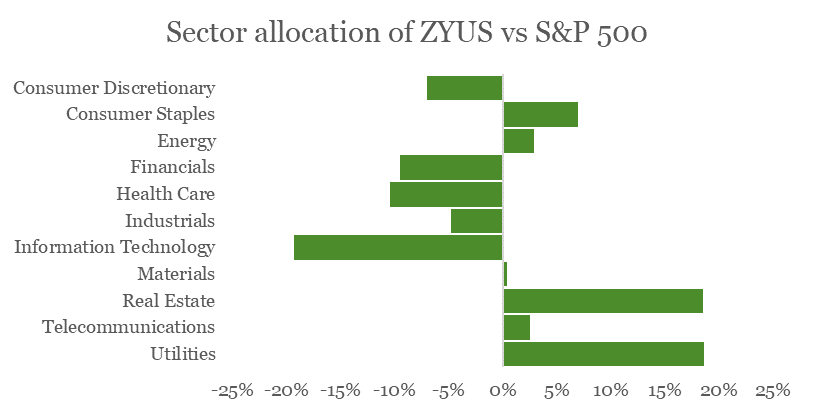
Chart 1: Comparison of sector allocations of ZYUS relative to the S&P 500
Source: Bloomberg data as at 30 June 2018.
How has ZYUS performed relative to the S&P 500?
In 2017 ZYUS underperformed the S&P 500 by nearly 9.6% as technology stocks accelerated away. This continued into early 2018 with ZYUS under-performing heavily in both January and February as the sell-off in defensives picked-up pace. This contrasts with 2016, where ZYUS outperformed by 8.8% . Monthly performance differentials are shown in Chart 3, below.
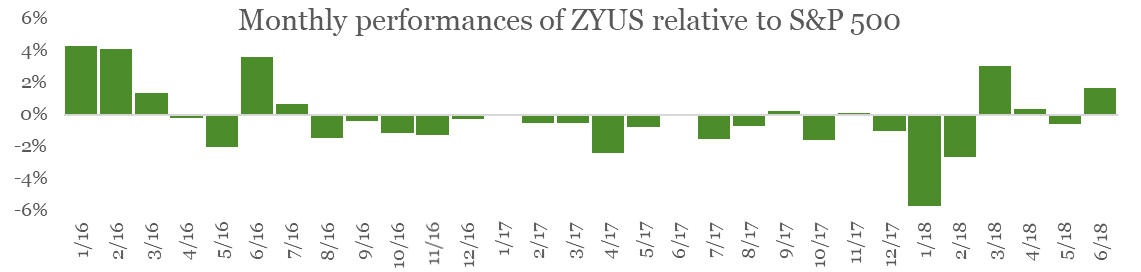
Chart 2: Monthly performances of ZYUS relative to the S&P 500 since January 2016 on an AUD total return basis.
Source: Bloomberg data as at 30 June 2018.
Since the end of February, however, ZYUS has outperformed in three of the four months and added 4.7% to the S&P 500 on an AUD total return basis.
Volatility-wise, on a 90-day historic basis, the spread between the S&P 500 and the S&P 500 Low Volatility High Dividend Index is currently at its lowest since 2012, as shown in Chart 3. Recently the low volatility screening is providing a degree of risk-reduction even in a more concentrated, 50-stock portfolio.
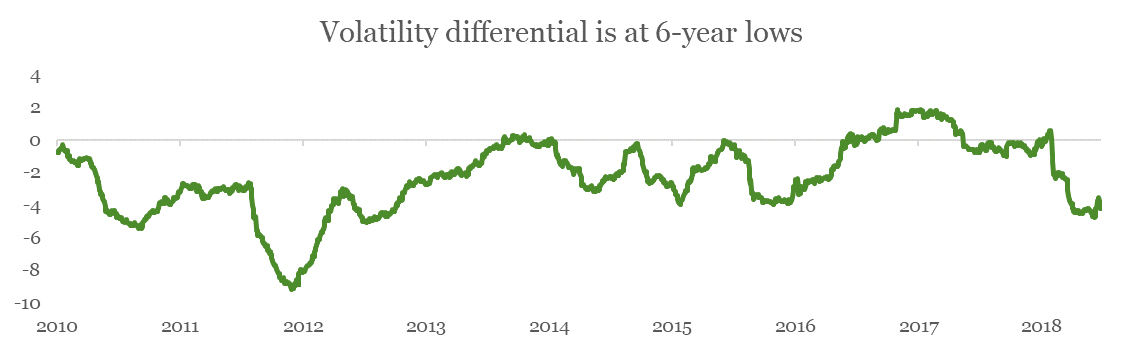
Chart 3: spread between 90-day rolling volatilities of the S&P 500 and the S&P 500 Low Volatility High Dividend Index
Source: Bloomberg as at 30 June 2018.
On a yield basis, the S&P 500 Low Volatility High Dividend Index is currently yielding 4.3%, which is more than double the yield on the S&P 500 at 1.9%.
Lastly, it is worth recalling that, despite the recent underperformance, the low volatility/high dividend strategy has outperformed the S&P 500 by over 6% per annum since the beginning of 2000, which demonstrates its ability to outperform across cycles.
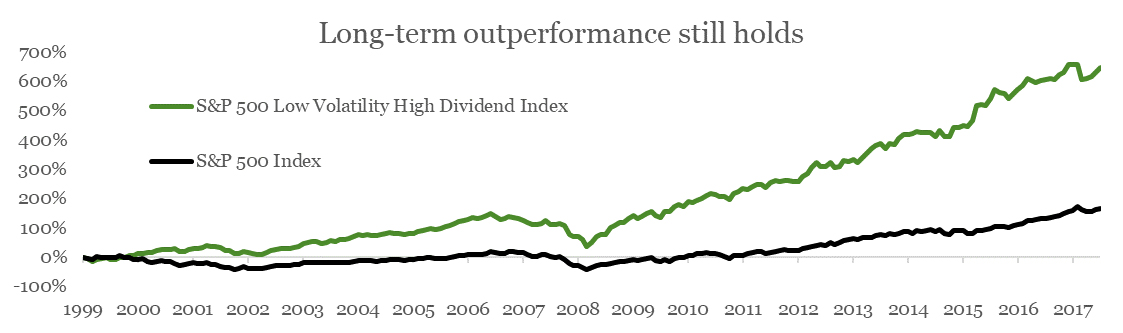
Chart 4: Total returns of the S&P 500 Low Volatility High Dividend Index and the S&P 500 (in US dollars) since 1 January 2000. The Index is live since 17 September 2012, performance prior to this is simulated.
Source: Bloomberg as at 30 June 2018.
How ZYUS invests
ETFS S&P 500 High Yield Low Volatility ETF (ZYUS) follows a rules-based strategy, tracking its benchmark Index, and has the following features:
• ZYUS captures the performance of a selection of the high yielding companies from the S&P 500 Index and aims to provide stable returns with regular income.
• ZYUS selects the 50 lowest volatility names from a list of the 75 highest yielding stocks at each rebalance.
• ZYUS is rebalanced semi-annually in January and July.
• ZYUS is weighted in proportion to the dividend yield of each constituent, meaning that the stocks with the highest yields receive the highest weightings.
• ZYUS applies individual stock and sector caps to ensure diversification.
• ZYUS has an MER of 0.35% p.a.
• ZYUS has a Recommended rating by Lonsec.
Summary
While low volatility and defensive sector strategies have underperformed over the past 12 to 18 months, with the U.S. possibly moving towards the latter stages of the current economic cycle, it could be a good time to re-visit these strategies. ZYUS provides a generally more defensive sector allocation than the broader market, uses a low-volatility screening and produces a consistently higher yield.
ETFS S&P 500 High Yield Low Volatility ETF factsheet
GET MORE INFORMATION
To sign up for future ETFS Trade ideas, email
To find out more about ETF Securities products, visit www.etfsecurities.com.au
RELATED ARTICLES


Sponsored features
Dissecting the Complexities of Cash Indices Regulations: An In-Depth Analysis
Introduction In recent years, the world of finance has seen a surge of interest in cash indices trading as investors seek potential returns in various markets. This development has brought increased ...Read more
Sponsored features
The Best Ways to Find the Right Trading Platform
Promoted by Animus Webs Read more

Sponsored features
How the increase in SMSF members benefits business owners
Promoted by ThinkTank Read more

Sponsored features
Thinktank’s evolution in residential lending and inaugural RMBS transaction
Promoted by Thinktank When Thinktank, a specialist commercial and residential property lender, recently closed its first residential mortgage-backed securitisation (RMBS) issue for $500 million, it ...Read more

Sponsored features
Investors tap into cyber space to grow their wealth
Promoted by Citi Group Combined, our daily spending adds up to opportunities for investors on a global scale. Read more

Sponsored features
Ecommerce boom as world adjusts to pandemic driven trends
Promoted by Citi Group COVID-19 has accelerated the use of technologies that help keep us connected, creating a virtual supply chain and expanded digital universe for investors. Read more

Sponsored features
Industrial property – the silver lining in the retail cloud
Promoted by ThinkTank Read more

Sponsored features
Why the non-bank sector appeals to SMSFs
Promoted by Think Tank Read more
Sponsored features
Dissecting the Complexities of Cash Indices Regulations: An In-Depth Analysis
Introduction In recent years, the world of finance has seen a surge of interest in cash indices trading as investors seek potential returns in various markets. This development has brought increased ...Read more
Sponsored features
The Best Ways to Find the Right Trading Platform
Promoted by Animus Webs Read more
Sponsored features
How the increase in SMSF members benefits business owners
Promoted by ThinkTank Read more
Sponsored features
Thinktank’s evolution in residential lending and inaugural RMBS transaction
Promoted by Thinktank When Thinktank, a specialist commercial and residential property lender, recently closed its first residential mortgage-backed securitisation (RMBS) issue for $500 million, it ...Read more
Sponsored features
Investors tap into cyber space to grow their wealth
Promoted by Citi Group Combined, our daily spending adds up to opportunities for investors on a global scale. Read more
Sponsored features
Ecommerce boom as world adjusts to pandemic driven trends
Promoted by Citi Group COVID-19 has accelerated the use of technologies that help keep us connected, creating a virtual supply chain and expanded digital universe for investors. Read more
Sponsored features
Industrial property – the silver lining in the retail cloud
Promoted by ThinkTank Read more
Sponsored features
Why the non-bank sector appeals to SMSFs
Promoted by Think Tank Read more


