


Resources
The Typical Australian
Promoted by

Recent Census results have show how the ‘average Australian’ is changing, as is the required services to support them. Let’s examine the implications on tax and investment.
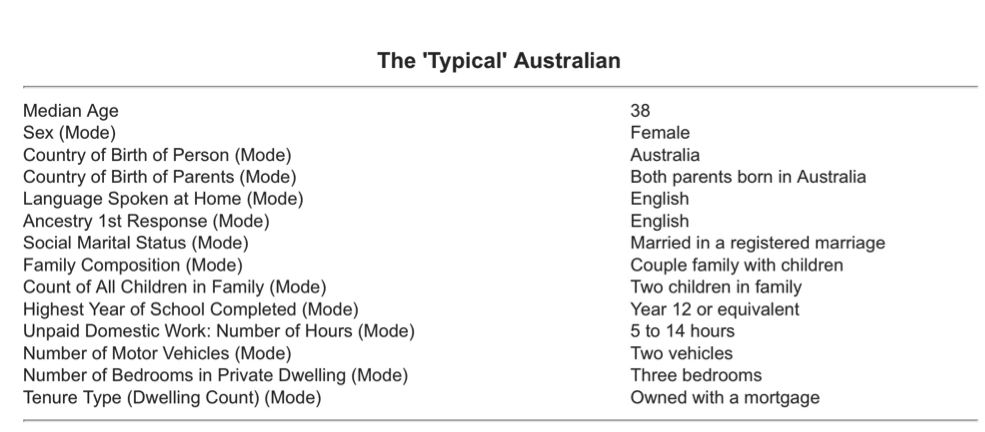
The Typical Australian

Promoted by
Recent Census results have show how the ‘average Australian’ is changing, as is the required services to support them. Let’s examine the implications on tax and investment.

The 2016 Census may go down in Australian history as a typical Australian stuff up, but it did produce some interesting charts and statistics. In spite of the drama in compiling our answers to a range of questions (via on line access), the Australian Bureau of Statistics (ABS) has been able to assemble some significant data on Australia. Importantly, the census pinpoints some trends that many may find uncomfortable to acknowledge.
Our first table outlines what the ABS found to be the average Australian. Based on recent revelations inside the brewing constitutional crisis, it may well be that the average Australian politician is not a typical Australian.
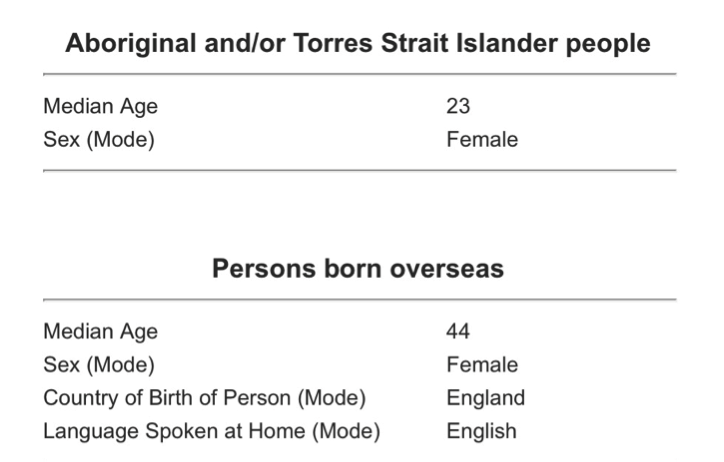
Other differences become apparent when a similar analysis is focused on Aboriginal and Torres Strait Islander people. Further, when the ABS delved into the average Australian born overseas, it found that many more English females had ventured to Australia than males and they did so in the 1980s and 1990s. Apparently many an English lady snapped up an average Aussie bloke – probably at a typical Aussie BBQ!
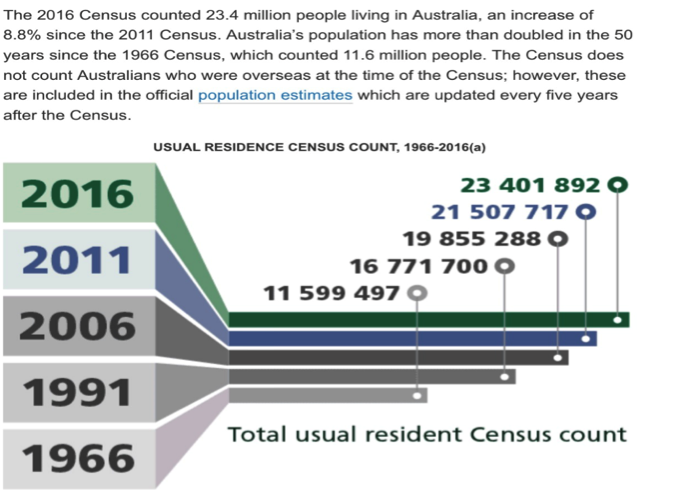
The following extract from the 2016 census confirms that Australia's population grew by nearly 2 million in the five years since the 2011 census. It has been the steady growth in population that has supported a range of businesses that supply essential products and services. Concurrently it has created a strain on governments in providing essential infrastructure and social services - more so given the Government’s historic reticence to invest or develop ahead of an orchestrated population surge.
Australia’s population growth is amongst the highest in the developed world. However this tailwind for the economy has not translated into a lift in the value of the Australian share market. Indeed, Australia’s economic growth has only translated into higher residential property prices and higher household debt.
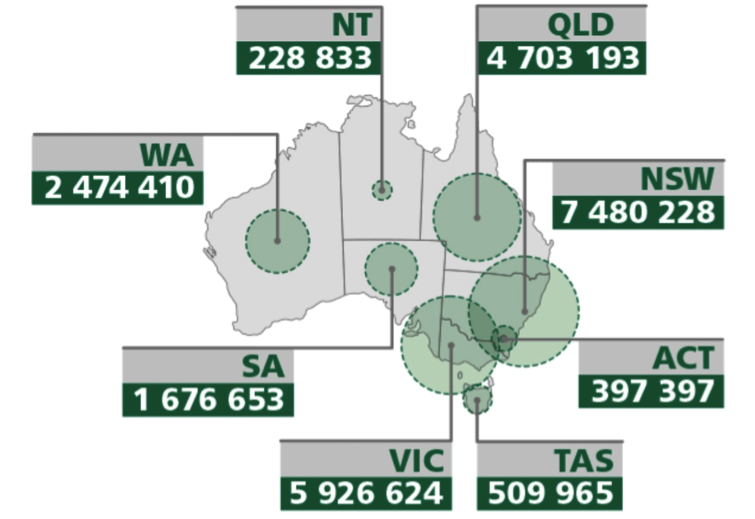
Of the 23.4 million Australian citizens, some 18.5 million live on the mainland’s east coast. The residential property price surge in SE Australia is substantially influenced by the desire of the typical Australian to live in this region. Immigrants are attracted to this area by the promise of jobs and higher relative economic growth. In doing so, many immigrants have compromised by taking jobs well below their educational status and below the average wage.
The above observations are needed to explain the next chart, which illustrates the differences in average wages across Australia. While the mining regions of Western Australia and the Northern Territory may still benefit from the legacy of the resources boom, it is the extraordinary excess of the ACT over the rest of Australia that stands out.
The demand by government agencies for private advisory services may well be the reason; it seems that many advisors have followed the riches and relocated to the nation’s capital.
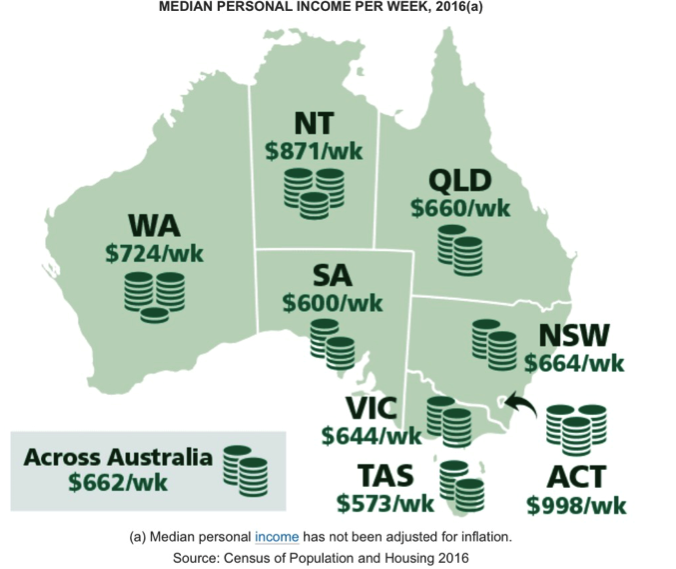
Noting that median incomes are 50% above the national average suggests that the ACT has become a parallel economy, external to the rest of the country. Arguably the pressures afflicting average households across Australia are less prevalent in the ACT.
In passing, the other point to note is that “median personal income per week” across Australia is equivalent to $33,000 per annum and a far cry from the average wage of about $80,000 per annum. This suggests a substantial underclass is developing in Australia and that many are sustained by social security.
It must be hoped that in time the full roll-out of the NBN across Australia will allow the Commonwealth Government to redistribute its many advisory contracts away from the ACT. One of the supposed benefits of an integrated and fast speed internet network was the promise of decentralised growth. At this point, it appears that Canberra may have completely forgotten this desirable outcome.
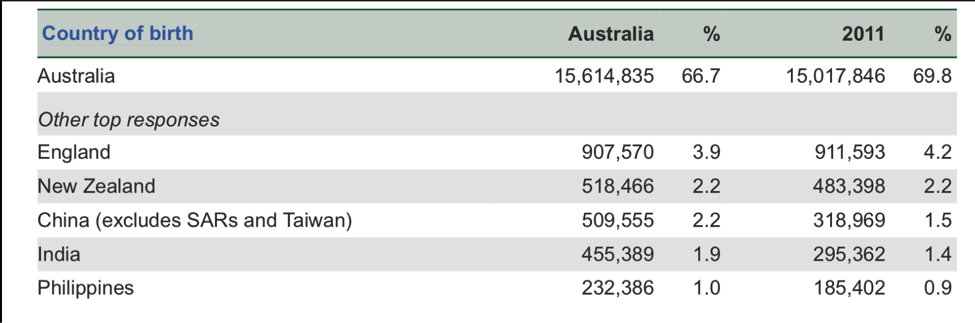
The next few charts show that immigration has substantially driven Australia's recent population growth, and this is illustrated by the significant decline (over 5 years) in the percentage of Australians born in Australia. While Australian born still dominate, based on current immigration and demographic patterns, within 3 decades more Australians will have been born offshore than onshore.
This development was probably not envisaged by the founding fathers who wrote the Australian Constitution, and so 115 years later it is causing much angst in Canberra as politicians scramble to determine their nationalities.
The effect of immigration is not only to grow the population but also to diversify it. This was exemplified in the census findings in answers to questions concerning religious affiliation. It shows that over the last 15 years, there has been a dramatic increase in those claiming to have no religion at all – from less than 1% in 1966 to 30% in 2016.
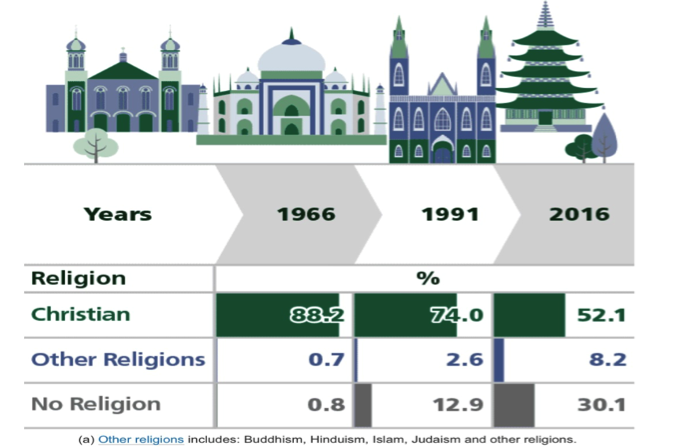
Why is this important? Amongst other reasons, if more Australians over time “disown” religion, it may test the community’s willingness to continue to cede many parts of our essential social services to religious-backed entities. Most notable is the primary education sector, which still has a heavy reliance upon Catholic educational services. Other sectors could be in healthcare, aged care services and support for the underprivileged.
The movement away from religious beliefs does suggest that essential service provision may fall back on the public sector. This may occur at a time when an ageing population puts more strain on the fiscal budget. The change in the profile of the typical Australian will likely have many consequences for the framework of Australian society, some creating real challenges for Australian politicians given our cultural and historical background. The upcoming debate and plebiscite on gay marriage is an example of changing attitudes clearly discernible from trends identified in the census.
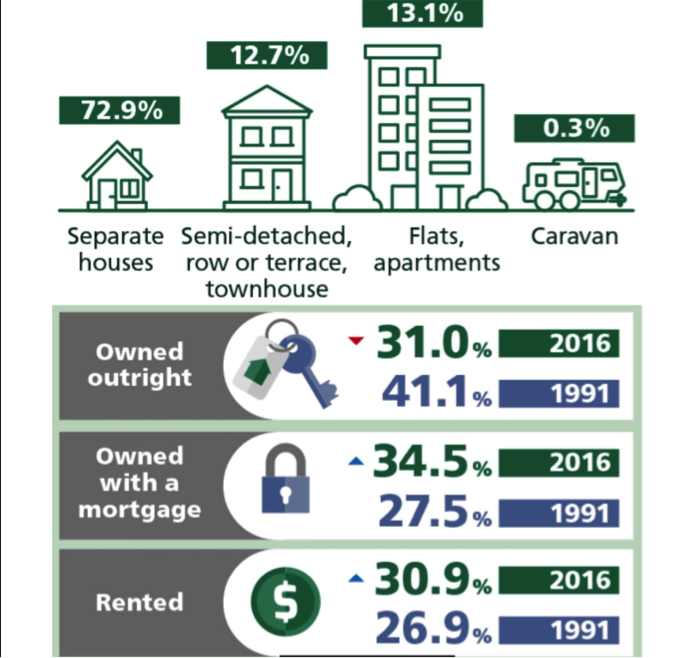
Another Australian trait is the desire to live in a free standing house. Indeed, this remains the feature of land redevelopment on the outskirts of both Sydney and Melbourne, where houses are built almost on top of each other on half-sized blocks.
However, poor public transport layouts or extensions will ensure that major cities will continue to see the surge in flats and apartments built alongside limited public transport lines leading into the cities or regional centres. Many apartments in the inner city will be claimed by retirees (downsizing) and recent immigrants. Trends and cycles acknowledged in the census suggest increasing percentages of mortgagees and renters as Australia’s population grows quicker than land release.
Other ABS statistics
Away from the census, the ABS reports regularly on Australia’s trade and employment. Typically the employment data is subject to much sceptical analysis by economists because the raw numbers appear to bounce around without logic.
Take last week’s announcement which followed a few months of sustained but unexplainable growth in full time employment, but then suddenly went into reverse. The report stated -
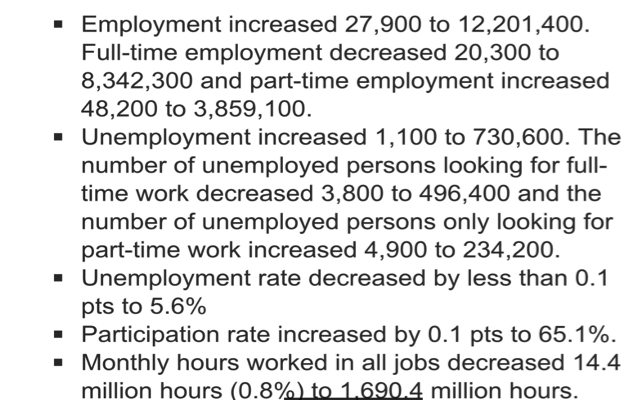
The sampling for the above is convoluted, but surely it does not make sense that when full time employment falls, the number of people looking for full time work also declines?
One factor that is coming through from these numbers (even if full of contradictions) is the observation from the census about immigration. There has clearly been a surge in immigration – most notably from 2009 to 2012. This surge included highly qualified and skilled workers, but many have landed in major cities unable to utilise their skills. The result is a lift in underemployment and a compression of wage rates as too many highly qualified people chase a limited number of qualified full time jobs.
On the trade account, the ABS has recently reported on FY 17. The numbers are impressive and investors should note the significant recovery in the trade account - $49 billion to be exact - that has recently supported the lift in the $A.
To quote the ABS -
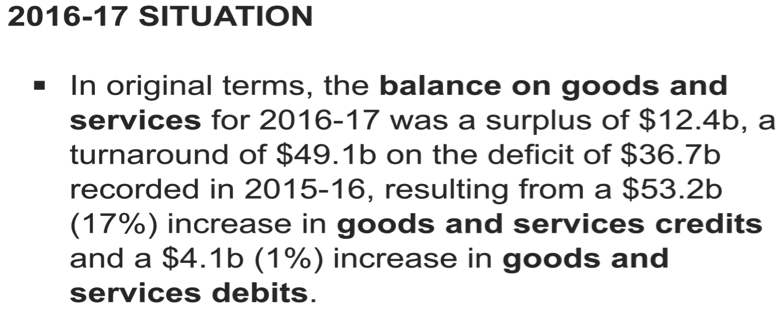
While the growth in “goods and services” exports (credits) was impressive, there should be some explanation for the listless growth in “goods and services” imports (debits). This resulted from a substantial decline in the importation of capital goods required for private investment. The end of the resources investment boom has resulted in export growth (volumes of bulk commodities and energy) and a drop in capital imports. Therefore, subject to commodity prices and the $A, Australia looks set to record a further trade surplus in FY 18. However, the continued growth in population and the resultant demand for imported consumables will eventually depress the trade surplus.
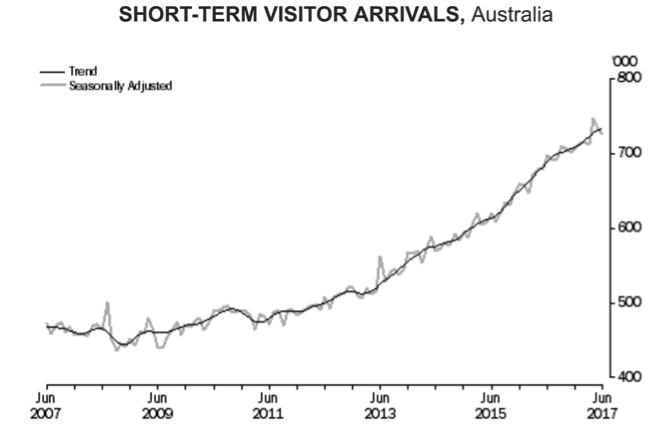
Also captured in trade data are both sides of the tourism trade. Here the growth in inbound tourism is as impressive as ever (chart below), but on the debit side the growth in outbound tourism remains a major offset.
The typical Australian baby boomer and young family is focused on travelling overseas, with over 800,000 Australians crossing the oceans in the month of June. From the table below, we can suggest that while the baby boomers headed to the US and Europe, younger families headed to Bali.
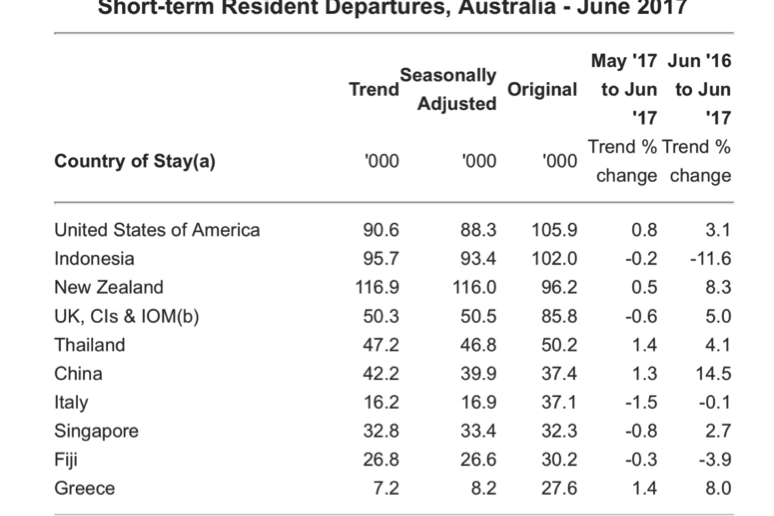
While the numbers of Australians travelling overseas is growing at half the rate of inbound tourism, it is strange that Australia is running a tourism services deficit. It is perhaps puzzling that 24 million people living in one of the world’s most desirable countries continually seek to travel offshore, and thereby offset the benefits of the rest of the world travelling to our country!
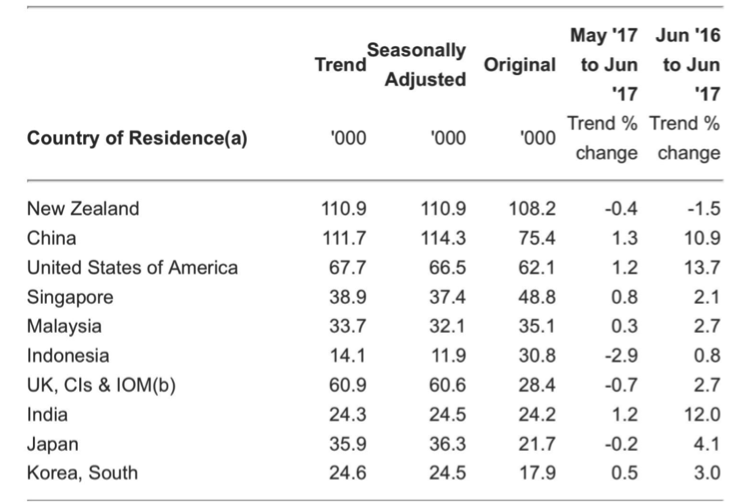
Maybe that is typical of Australia - we just don’t realise how lucky we. However, the people that come here surely do. You can see them in the final ABS table.
Clime is an independent, highly esteemed Australian fund manager specialising in value investing and focused on delivering absolute returns. To access Investing Reports and exclusive white papers, click here.
RELATED ARTICLES

Sponsored features
Dissecting the Complexities of Cash Indices Regulations: An In-Depth Analysis
Introduction In recent years, the world of finance has seen a surge of interest in cash indices trading as investors seek potential returns in various markets. This development has brought increased ...Read more
Sponsored features
The Best Ways to Find the Right Trading Platform
Promoted by Animus Webs Read more

Sponsored features
How the increase in SMSF members benefits business owners
Promoted by ThinkTank Read more

Sponsored features
Thinktank’s evolution in residential lending and inaugural RMBS transaction
Promoted by Thinktank When Thinktank, a specialist commercial and residential property lender, recently closed its first residential mortgage-backed securitisation (RMBS) issue for $500 million, it ...Read more

Sponsored features
Investors tap into cyber space to grow their wealth
Promoted by Citi Group Combined, our daily spending adds up to opportunities for investors on a global scale. Read more

Sponsored features
Ecommerce boom as world adjusts to pandemic driven trends
Promoted by Citi Group COVID-19 has accelerated the use of technologies that help keep us connected, creating a virtual supply chain and expanded digital universe for investors. Read more

Sponsored features
Industrial property – the silver lining in the retail cloud
Promoted by ThinkTank Read more

Sponsored features
Why the non-bank sector appeals to SMSFs
Promoted by Think Tank Read more
Sponsored features
Dissecting the Complexities of Cash Indices Regulations: An In-Depth Analysis
Introduction In recent years, the world of finance has seen a surge of interest in cash indices trading as investors seek potential returns in various markets. This development has brought increased ...Read more
Sponsored features
The Best Ways to Find the Right Trading Platform
Promoted by Animus Webs Read more
Sponsored features
How the increase in SMSF members benefits business owners
Promoted by ThinkTank Read more
Sponsored features
Thinktank’s evolution in residential lending and inaugural RMBS transaction
Promoted by Thinktank When Thinktank, a specialist commercial and residential property lender, recently closed its first residential mortgage-backed securitisation (RMBS) issue for $500 million, it ...Read more
Sponsored features
Investors tap into cyber space to grow their wealth
Promoted by Citi Group Combined, our daily spending adds up to opportunities for investors on a global scale. Read more
Sponsored features
Ecommerce boom as world adjusts to pandemic driven trends
Promoted by Citi Group COVID-19 has accelerated the use of technologies that help keep us connected, creating a virtual supply chain and expanded digital universe for investors. Read more
Sponsored features
Industrial property – the silver lining in the retail cloud
Promoted by ThinkTank Read more
Sponsored features
Why the non-bank sector appeals to SMSFs
Promoted by Think Tank Read more


