Invest
The suburbs where your property will pay for itself
Spoiler alert: they’re not in Sydney or Melbourne.
The suburbs where your property will pay for itself
Property analyst Propertyology has released research naming the top capital city suburbs for rental properties, with Sydney, Melbourne and Canberra notably absent.
“Our research proves there are plenty of suburbs within Australia’s capital cities where high rent returns make it easier on landlords to patiently wait for equity gains,” said Propertyology managing director Simon Pressley.
“In some locations, even with a low 10 per cent deposit, the typical property is putting money back into the owner’s pocket each year.”
However, the nation’s premier cities have a paucity of suburbs in which an investor can purchase a detached house and have it be cash flow positive with a deposit of 20 per cent or less.

Noting that cash flow is only one factor in what makes an investment property worthwhile, Mr Pressley said investors looking for strong cash flow need to expand their horizons.
“Even though it’s 80 kilometres from Sydney’s [CBD], the Central Coast (Wyong and Gosford) are technically part of greater Sydney, while Medlow Bath in the Blue Mountains has a median house price of $500,000,” he said.
“Compare that to somewhere like Blacktown, 38 kilometres west of Sydney. That suburb has a median house price of $740,000 and a property there will cost $11,775 per year to maintain, even if you have a 20 per cent deposit.”
“The figures are even worse for Hornsby, where a median house price of $1.33 million will leave you $26,152 a year worse off.”
That’s before investors account for the end of Sydney’s growth phase, Mr Pressley said, adding that Victoria is in a similar situation.
“Victoria paints a similar picture with greater Melbourne’s best locations for cash flow investors within the municipality of Melton – 40 kilometres north-west of the CBD,” he said.
“Here, the median house price is around $400,000 and will cost those with a 20 per cent deposit just $4,000 per year to hold.”
Then there’s inner city Brunswick, which demands an average $23,805 a year to maintain the holding: “A tough ask if you’re trying to be patient.”
However, Mr Pressley acknowledged that high cash flow and capital growth potential don’t necessarily go hand-in-hand.
Nevertheless, he said, “they can be found in every state”.
So, which suburbs made the cut?
|
Suburb |
Distance |
Median |
Annual holding costs @ 80% LVR |
Annual holding costs @ 80% LVR |
|
Karama, NT |
10.5 |
$392,000 |
$ 3,682 |
$ 1,722 |
|
Coopers Plains, Qld |
15.0 |
$398,750 |
$ 3,632 |
$ 1,638 |
|
Risdon Vale, Tas |
8.1 |
$222,500 |
$ 3,435 |
$ 2,322 |
|
Gagebrook, Tas |
16.1 |
$170,000 |
$ 3,339 |
$ 2,489 |
|
Chigwell, Tas |
10.7 |
$260,000 |
$ 3,033 |
$ 1,733 |
|
Muirhead, NT |
12.0 |
$650,000 |
$ 2,915 |
($ 335) |
|
Cedar Vale, Qld |
45.7 |
$480,000 |
$ 2,797 |
$ 397 |
|
New Norfolk, Tas |
24.8 |
$212,500 |
$ 2,737 |
$ 1,674 |
|
Bridgewater, Tas |
17.2 |
$210,000 |
$ 2,617 |
$ 1,567 |
|
Malak, NT |
10.1 |
$450,000 |
$ 2,460 |
$ 210 |
|
Davoren Park, SA |
27.0 |
$188,750 |
$ 2,369 |
$ 1,425 |
|
Smithfield Plains, SA |
28.2 |
$199,500 |
$ 2,219 |
$ 1,257 |
|
Elizabeth North, SA |
26.1 |
$197,750 |
$ 2,089 |
$ 1,110 |
|
Elizabeth East, SA |
22.7 |
$210,000 |
$ 1,958 |
$ 908 |
|
Russell Island, Qld |
41.2 |
$190,000 |
$ 1,880 |
$ 930 |
|
Wagaman, NT |
10.2 |
$490,000 |
$ 1,738 |
$ 712 |
|
Blackstone, Qld |
28.0 |
$301,000 |
$ 1,612 |
$ 107 |
|
Gailes, Qld |
19.4 |
$250,000 |
$ 1,456 |
|
|
Virginia, NT |
22.7 |
$630,000 |
$ 1,409 |
$ 1,741 |
|
Hackham West, SA |
23.7 |
$261,500 |
$ 1,216 |
($ 92) |
|
Brookdale, WA |
27.5 |
$258,000 |
$ 917 |
($ 373) |
|
Hillman, WA |
37.7 |
$278,000 |
$ 117 |
($ 1,273) |
|
Dayton, WA |
15.1 |
$432,500 |
$ 86 |
($ 2,077) |
|
Gilmore, ACT |
15.5 |
$545,000 |
($ 22) |
($ 2,747) |
|
Medina, WA |
31.5 |
$238,000 |
($ 40) |
($ 1,230) |
|
Gowrie, ACT |
14.9 |
$576,500 |
($ 404) |
($ 3,287) |
|
Richardson, ACT |
16.6 |
$495,000 |
($ 438) |
($ 2,913) |
|
Armadale, WA |
25.7 |
$250,000 |
($ 520) |
($ 1,770) |
|
Charnwood, ACT |
12.2 |
$460,000 |
($ 575) |
($ 2,875) |
|
Calwell, ACT |
18.0 |
$550,000 |
($ 881) |
($ 3,631) |
|
Millgrove, Vic |
61.7 |
$365,000 |
($ 1,826) |
($ 3,651) |
|
Rockbank, Vic |
27.9 |
$505,000 |
($ 2,375) |
($ 4,900) |
|
Kurunjang, Vic |
36.9 |
$388,750 |
($ 2,996) |
($ 4,939) |
|
Lake Munmorah, NSW |
82.1 |
$490,000 |
($ 3,093) |
($ 5,543) |
|
Watanobbi, NSW |
68.8 |
$495,000 |
($ 3,293) |
($ 5,768) |
|
Mannering Park, NSW |
85.2 |
$480,000 |
($ 3,681) |
($ 6,081) |
|
Kanwal, NSW |
69.4 |
$495,000 |
($ 3,732) |
($ 6,207) |
|
San Remo, NSW |
77.4 |
$465,000 |
($ 3,740) |
($ 6,065) |
|
Melton South, Vic |
36.4 |
$398,000 |
($ 3,915) |
($ 5,905) |
|
Warburton, VIC |
64.7 |
$423,500 |
($ 3,946) |
($ 6,064) |
These calculations are based on median house values and median rents as at May 2018, with annual holding costs based on four weeks vacancy a year, 4.5 per cent loan interest and general provisions for property management fees, council rates, maintenance and insurance.

Property
Multigenerational living is moving mainstream: how agents, developers and lenders can monetise the shift
Australia’s quiet housing revolution is no longer a niche lifestyle choice; it’s a structural shift in demand that will reward property businesses prepared to redesign product, pricing and ...Read more

Property
Prestige property, precision choice: a case study in selecting the right agent when millions are at stake
In Australia’s top-tier housing market, the wrong agent choice can quietly erase six figures from a sale. Privacy protocols, discreet buyer networks and data-savvy marketing have become the new ...Read more
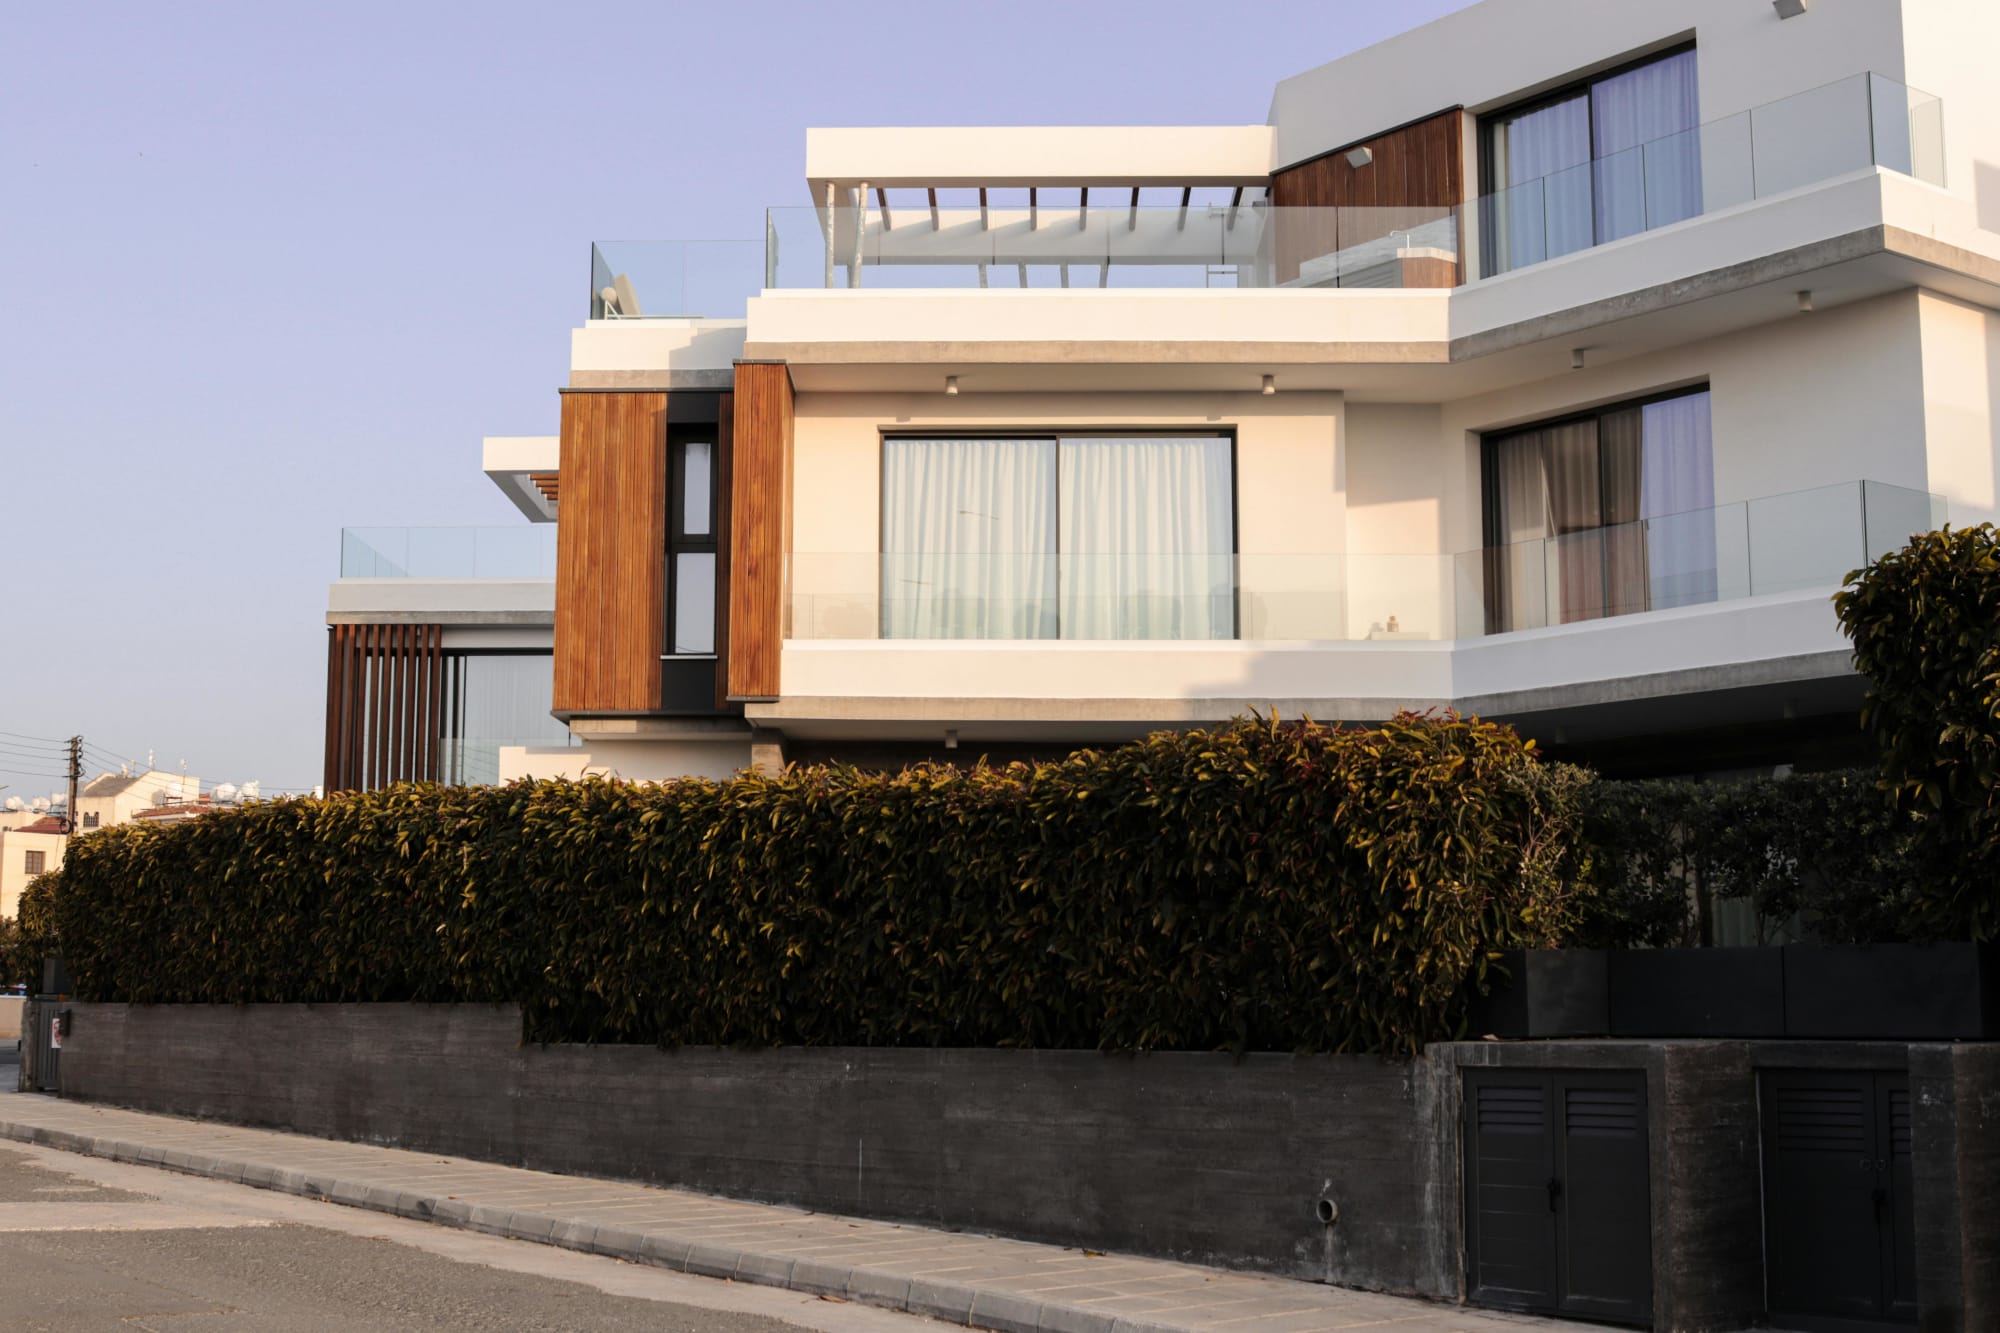
Property
From ‘ugly’ to alpha: Turning outdated Australian homes into high‑yield assets
In a tight listings market, outdated properties aren’t dead weight—they’re mispriced optionality. Agencies and vendors that industrialise light‑touch refurbishment, behavioural marketing and ...Read more

Property
The 2026 Investor Playbook: Rental Tailwinds, City Divergence and the Tech-Led Operations Advantage
Rental income looks set to do the heavy lifting for investors in 2026, but not every capital city will move in lockstep. Industry veteran John McGrath tips a stronger rental year and a Melbourne ...Read more

Property
Prestige property, precision choice: Data, discretion and regulation now decide million‑dollar outcomes
In Australia’s prestige housing market, the selling agent is no longer a mere intermediary but a strategic supplier whose choices can shift outcomes by seven figures. The differentiators are no longer ...Read more

Property
The new battleground in housing: how first-home buyer policy is reshaping Australia’s entry-level market
Government-backed guarantees and stamp duty concessions have pushed fresh demand into the bottom of Australia’s price ladder, lifting values and compressing selling times in entry-level segmentsRead more
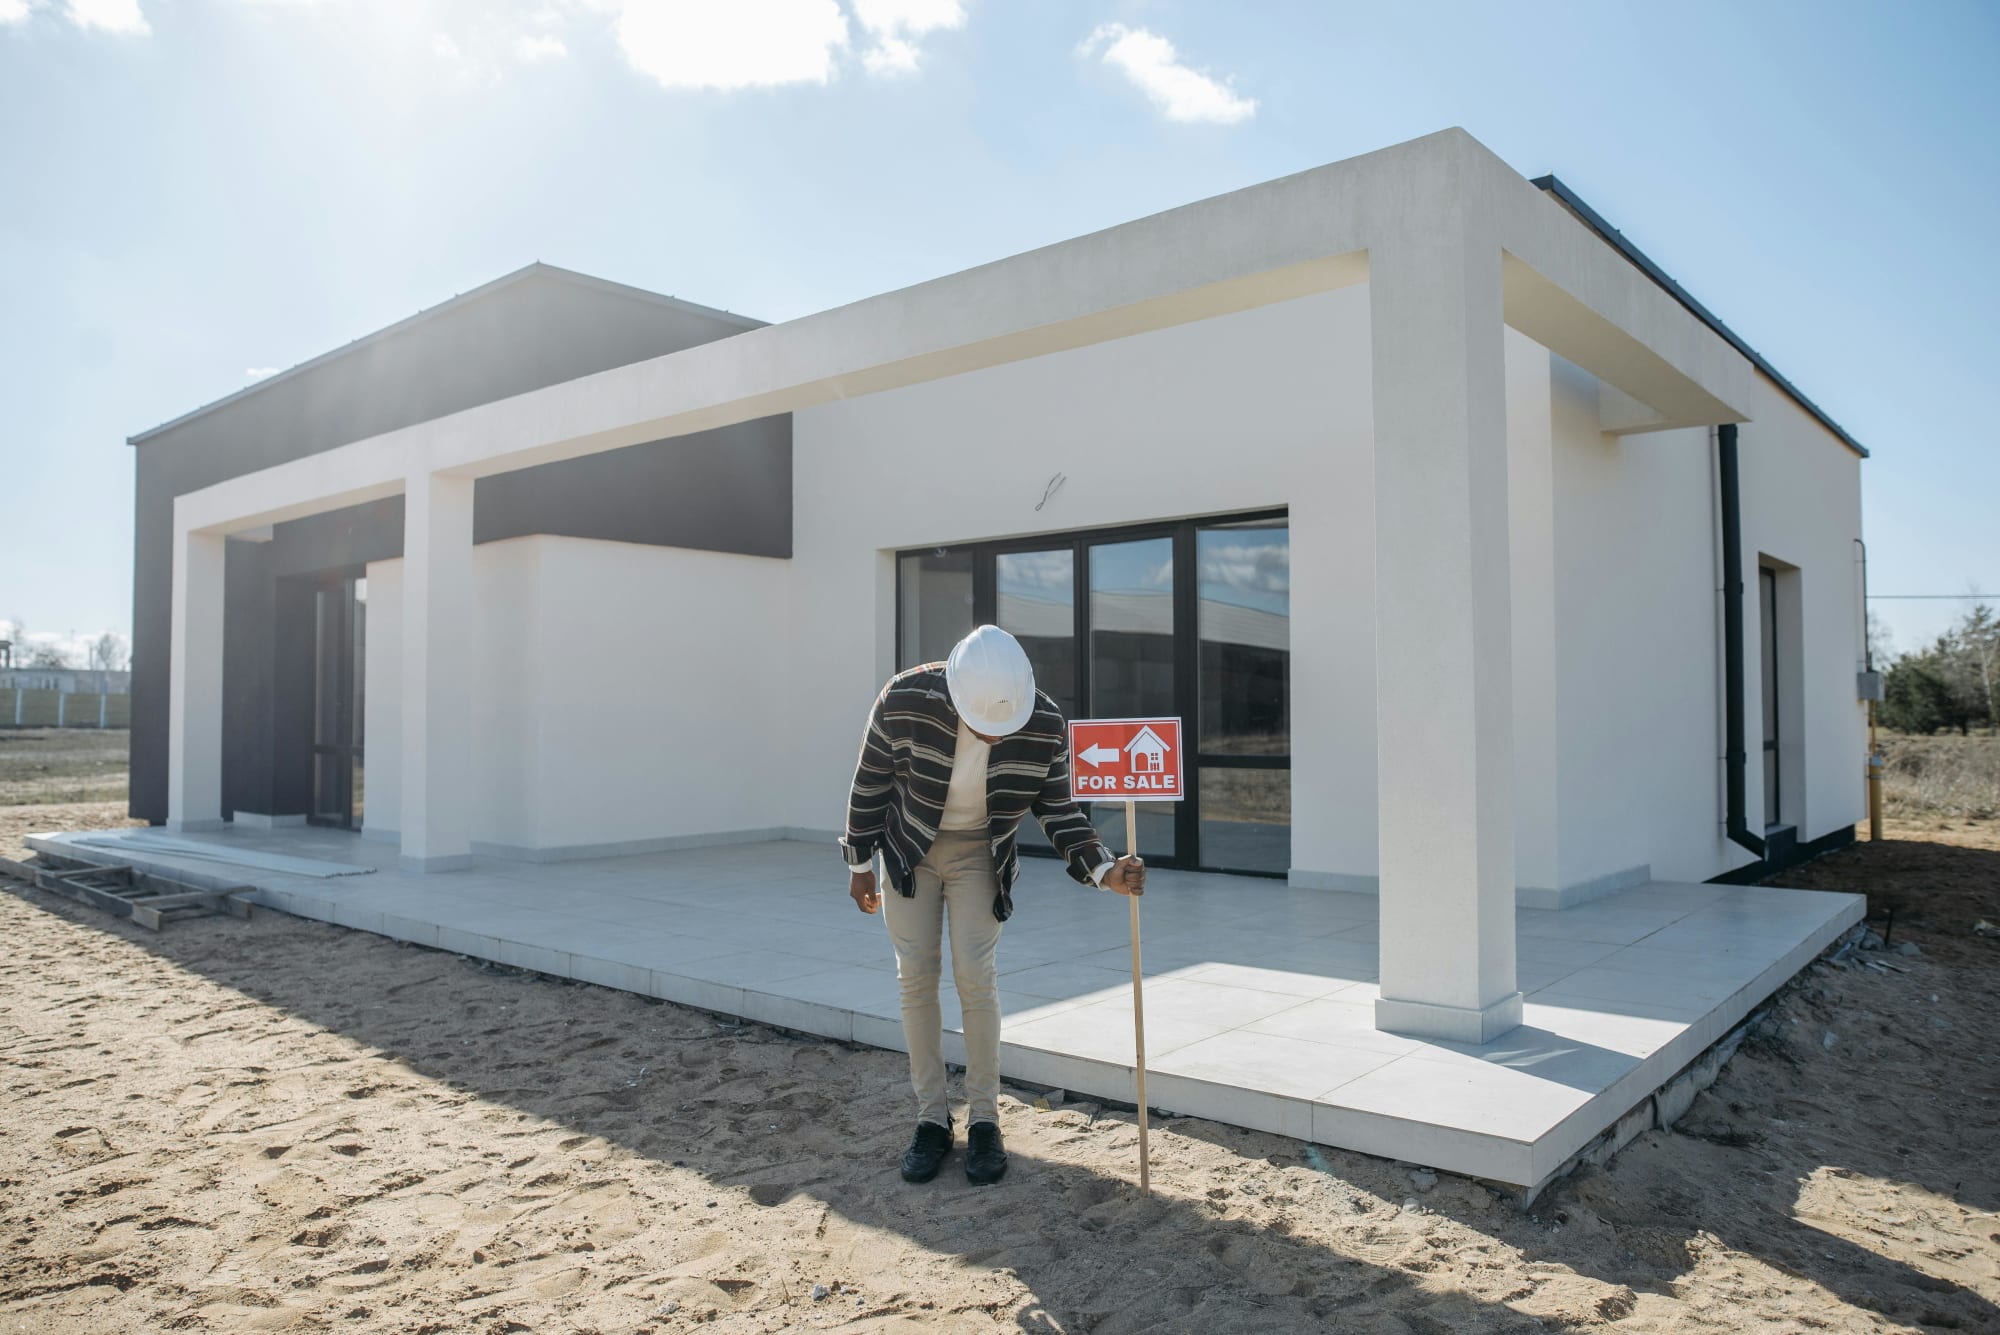
Property
Property 2026: Why measured moves will beat the market
In 2026, Australian property success will be won by investors who privilege resilience over velocity. The market is fragmenting by suburb and asset type, financing conditions remain tight, and ...Read more
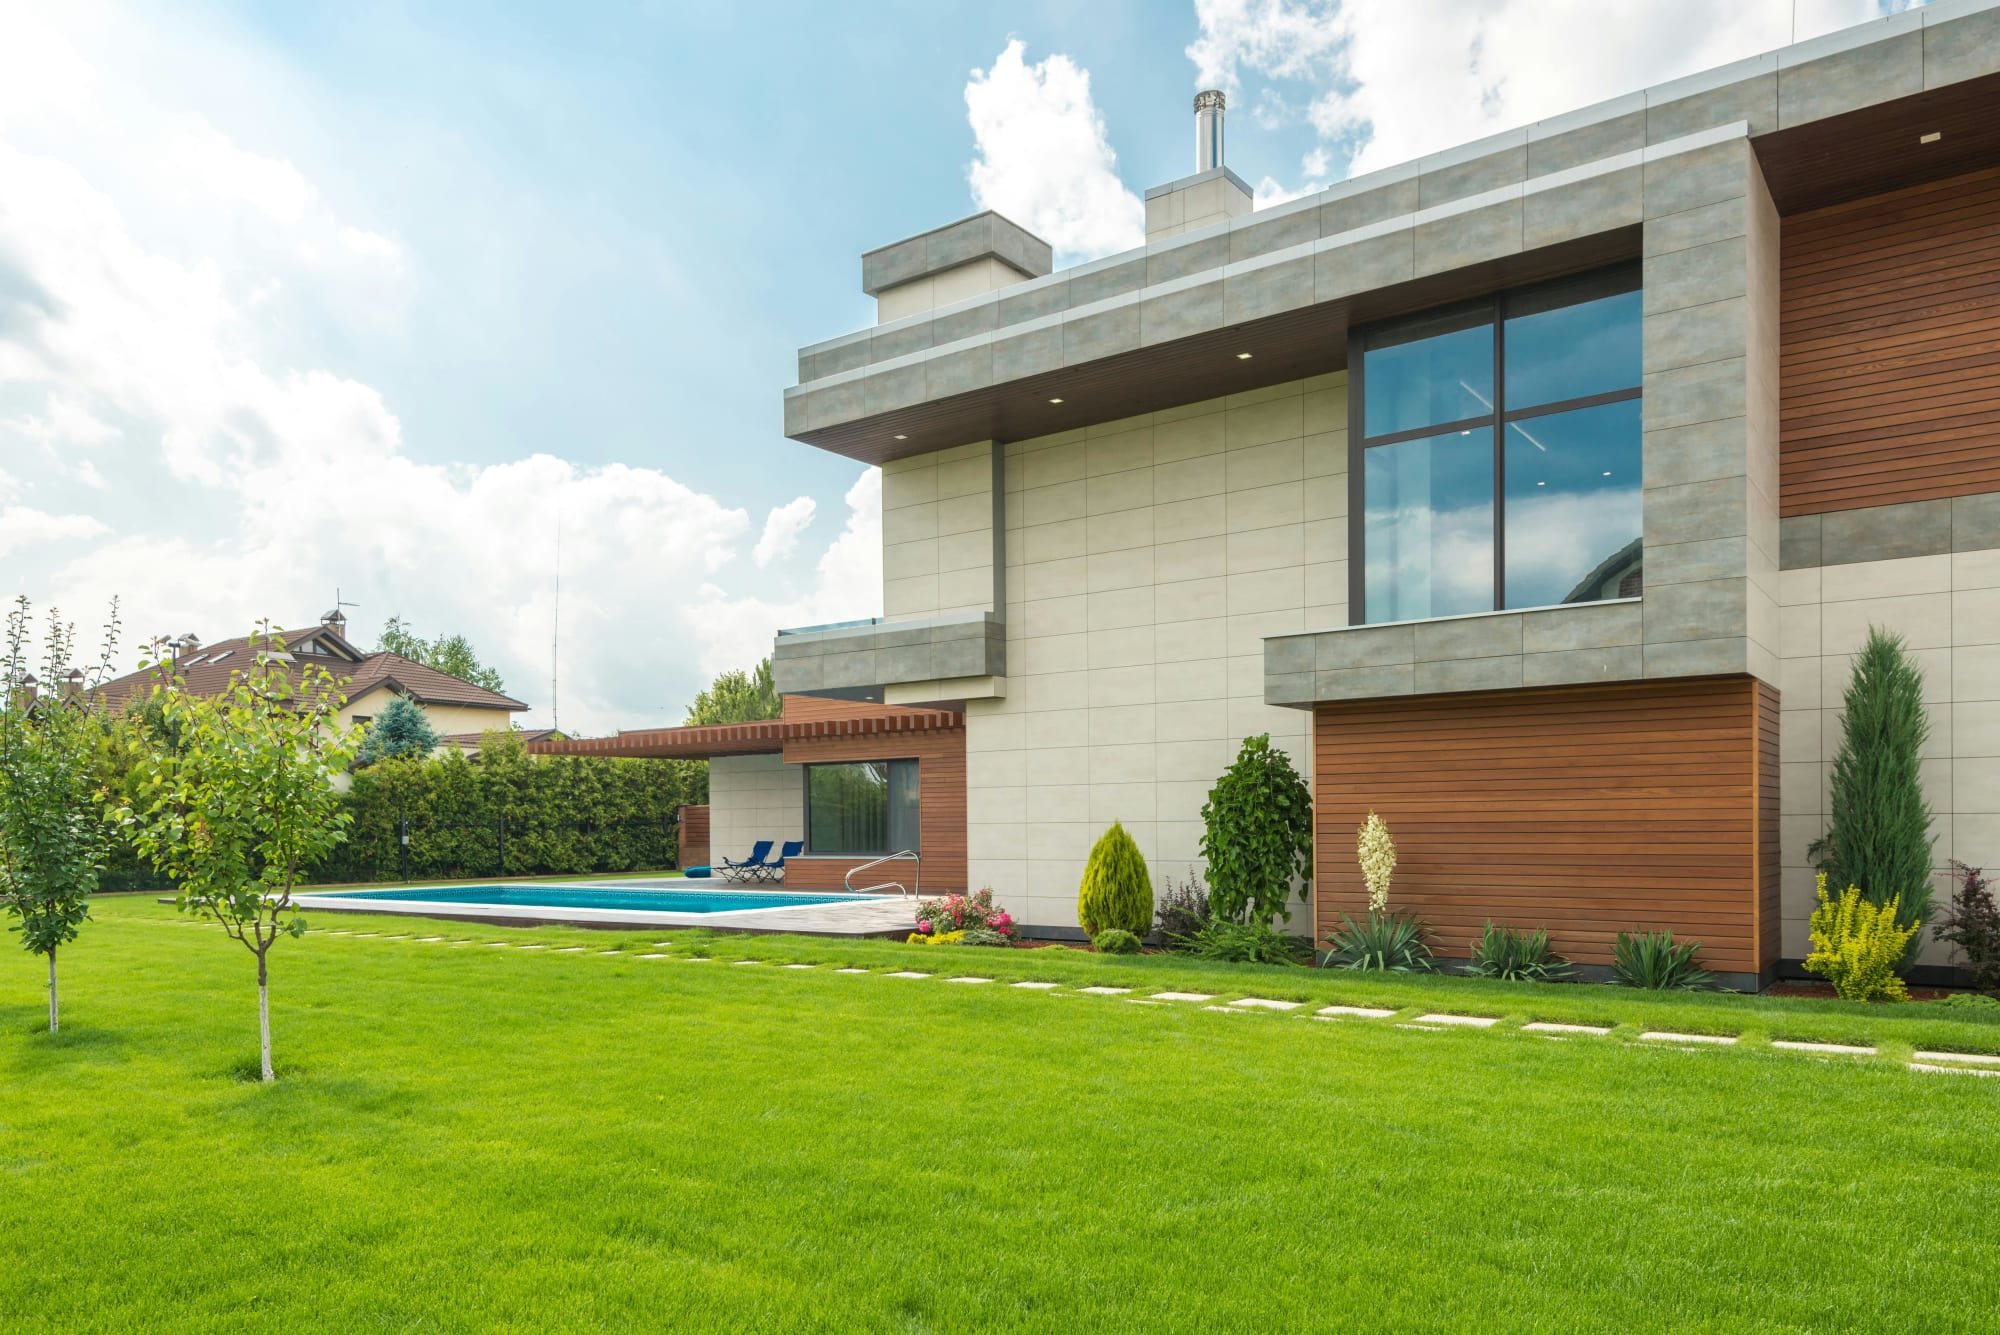
Property
Entry-level property is winning: How first home buyer programs are reshaping demand, pricing power and strategy
Lower-priced homes are appreciating faster as government support channels demand into the entry tier. For developers, lenders and marketers, this is not a blip—it’s a structural reweighting of demand ...Read more

Property
Multigenerational living is moving mainstream: how agents, developers and lenders can monetise the shift
Australia’s quiet housing revolution is no longer a niche lifestyle choice; it’s a structural shift in demand that will reward property businesses prepared to redesign product, pricing and ...Read more

Property
Prestige property, precision choice: a case study in selecting the right agent when millions are at stake
In Australia’s top-tier housing market, the wrong agent choice can quietly erase six figures from a sale. Privacy protocols, discreet buyer networks and data-savvy marketing have become the new ...Read more

Property
From ‘ugly’ to alpha: Turning outdated Australian homes into high‑yield assets
In a tight listings market, outdated properties aren’t dead weight—they’re mispriced optionality. Agencies and vendors that industrialise light‑touch refurbishment, behavioural marketing and ...Read more

Property
The 2026 Investor Playbook: Rental Tailwinds, City Divergence and the Tech-Led Operations Advantage
Rental income looks set to do the heavy lifting for investors in 2026, but not every capital city will move in lockstep. Industry veteran John McGrath tips a stronger rental year and a Melbourne ...Read more

Property
Prestige property, precision choice: Data, discretion and regulation now decide million‑dollar outcomes
In Australia’s prestige housing market, the selling agent is no longer a mere intermediary but a strategic supplier whose choices can shift outcomes by seven figures. The differentiators are no longer ...Read more

Property
The new battleground in housing: how first-home buyer policy is reshaping Australia’s entry-level market
Government-backed guarantees and stamp duty concessions have pushed fresh demand into the bottom of Australia’s price ladder, lifting values and compressing selling times in entry-level segmentsRead more

Property
Property 2026: Why measured moves will beat the market
In 2026, Australian property success will be won by investors who privilege resilience over velocity. The market is fragmenting by suburb and asset type, financing conditions remain tight, and ...Read more

Property
Entry-level property is winning: How first home buyer programs are reshaping demand, pricing power and strategy
Lower-priced homes are appreciating faster as government support channels demand into the entry tier. For developers, lenders and marketers, this is not a blip—it’s a structural reweighting of demand ...Read more


