


Invest
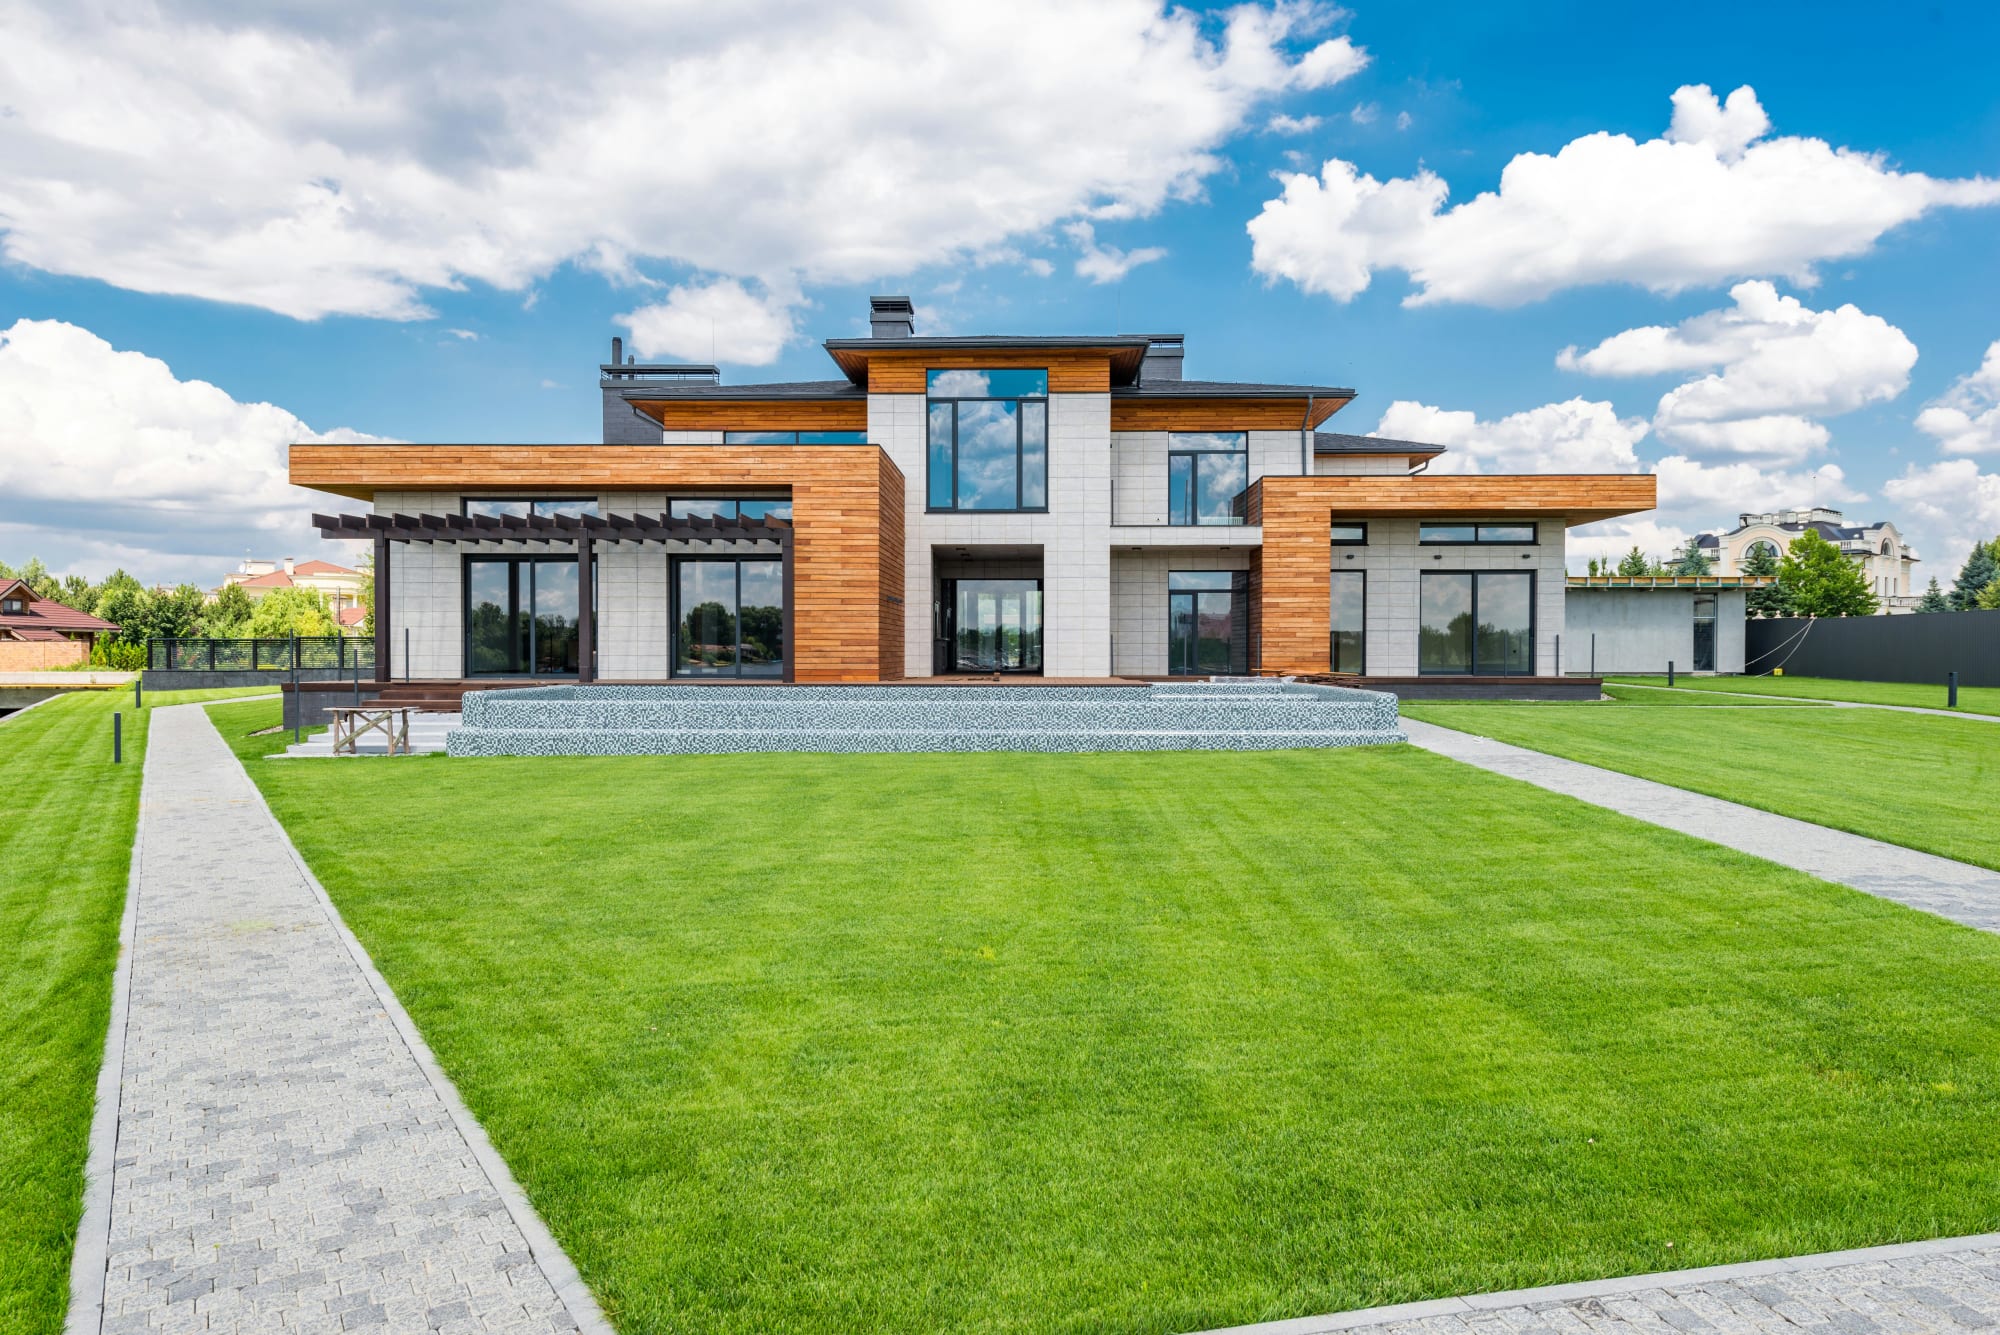
This is what Australia’s most advantaged area looks like
Census data has shone a spotlight on Australia’s most advantaged suburbs, and probably woken up a few green-eyed monsters of jealousy while doing so.
This is what Australia’s most advantaged area looks like

Census data has shone a spotlight on Australia’s most advantaged suburbs, and probably woken up a few green-eyed monsters of jealousy while doing so.

Ku-ring-gai took out the title for most advantaged local government area (LGA), according to the 2016 Census.
The leafy upper north shore area was ranked number one in terms of socio-economic advantage.
Home to 118,000 residents on census night, Ku-ring-gai includes the suburbs of Pymble, Turramurra and Killara.
According to ABS figures, these 118,000 residents enjoy a median total income excluding government pensions and allowances that, at $55,448, is more than $10,000 more than the Australian $44,940 average.
This is useful, given that Ku-ring-gai residents’ average monthly household mortgage payment is $1,403 larger than the national average of $1,994.
Knox Grammar School in the Ku-ring-gai suburb of Wahroonga can see annual fees hit $31,830 for senior students, so that higher median income comes in handy again.
It’s about the same for students attending Pymble Ladies’ College, with senior fees hitting $31,425 a year.
Parents also have the option of sending their children to the local state school, Ku-ring-gai High School.
According to Nest Egg sister title Smart Property Investment analysis of CoreLogic data, the median price for a house in Pymble is $2,387,500.
However, Pymble’s Federation House, which features a tennis court and a pool, sold in late December for $4,875,000.
Sister-suburb, North Turramurra has seen its property prices increase to the tune of 55.38 per cent capital gain. Slightly more affordable than Pymble, average house prices in North Turramurra are $1,919,000.
Neighbouring North Wahroonga has seen a staggering 88.09 per cent capital gains growth over the last five years, with the average house price sitting at $1,768,000.
Responding to the ABS findings, Ku-ring-gai mayor Jennifer Anderson said that despite the ABS’ judgement of Ku-ring-gai’s privilege, the LGA still has much to do.
“Around 40 per cent of our residents are migrants and many of these are non-English speaking, needing our help to build their lives here,” Ms Anderson said.
“The 2016 census data also shows that we have far higher proportions of the very young and the very old, and these age groups are set to increase in the next 20 to 30 years. Providing facilities and services for those aged over 80 and under 30 is at the forefront of our strategic planning.
“The council has long-term plans in place to respond to our changing population, including multimillion-dollar redevelopments of major centres such as Lindfield, Turramurra and Gordon.”
Coming second after Ku-ring-gai is Mosman, which includes the wealthy suburbs of Balmoral, Beauty Point and Clifton Gardens.
The most disadvantaged
On the other end of the spectrum, Cherbourg, an LGA about 250 kilometres north-west of Brisbane is home to 1,269 people. The top 10 most disadvantaged areas were all in Queensland and the Northern Territory, while the most advantaged were all in NSW or Western Australia.
Outside of state lines, racial lines also dictate – or at least reflect – the disparity.
Thirty per cent of people born in China, South Africa and Malaysia live in advantaged areas, with less than 10 per cent living in disadvantaged areas. However, 40 per cent of Vietnamese-born Australian residents live in disadvantaged areas, with only 11 per cent living in advantaged areas.
Aboriginal and Torres Strait Islander Australians are much more likely to live in the most disadvantaged areas (48 per cent) than their non-Indigenous counterparts (18 per cent).
Correspondingly, only 5.4 per cent of Indigenous Australians live in areas of high advantage, compared with 22 per cent of non-Indigenous people.
10 most advantaged areas
| Rank | LGA | Usual resident population |
| 1 | Ku-ring-gai (NSW) | 118,053 |
| 2 | Mosman (NSW) | 28,475 |
| 3 | Woollahra (NSW) | 54,240 |
| 4 | Cottesloe (WA) | 7,597 |
| 5 | Peppermint Grove (WA) | 1,636 |
| 6 | Nedlands (WA) | 21,121 |
| 7 | North Sydney (NSW) | 67,658 |
| 8 | Lane Cove (NSW) | 36,051 |
| 9 | Cambridge (WA) | 26,783 |
| 10 | Hunters Hill (NSW) | 13,999 |
10 most disadvantaged areas
| Rank | LGA | Usual resident population |
| 1 | Cherbourg (Qld) | 1,269 |
| 2 | West Daly (NT) | 3,166 |
| 3 | Belyuen (NT) | 164 |
| 4 | Woorabinda (Qld) | 962 |
| 5 | Central Desert (NT) | 3,677 |
| 6 | Aurukun (Qld) | 1,269 |
| 7 | Yarrabah (Qld) | 2,559 |
| 8 | Doomadgee (Qld) | 1,405 |
| 9 | Napranum (Qld) | 957 |
| 10 | Palm Island (Qld) | 2,446 |
RELATED ARTICLES
Property
Australian property’s quiet pivot: resilience hides a new competitive map
Australia’s housing market remains sturdier than the macro noise suggests, but the sources of resilience have shifted. For operators, the profit pool is migrating from ‘volume at any price’ to ...Read more

Property
Gen Z’s 5% deposit rush: how policy‑driven demand is reshaping Australia’s housing value chain
A government-backed 5% deposit guarantee has triggered a surge in first-home buyer intent among Gen Z, pulling forward demand and resetting competition across banks, brokers and buildersRead more

Property
Cautious bidders, smarter sellers: a Queensland auction case study on repricing risk
Queensland’s auction market has hit a caution cycle as buyers price in higher borrowing costs, global uncertainty and cost-of-living pressure. Clearance softness is forcing agencies to re-engineer ...Read more

Property
Trust, technology and triage: what NSW’s ‘name and shame’ signals for real estate governance
NSW’s latest enforcement action on real estate trust accounts isn’t a one-off embarrassment; it’s a stress test of sector governance. With licences suspended and penalties applied, the message is ...Read more

Property
Vacancy is rising, demand is resilient: A case study in defending yield as Australia’s rental cycle rebalances
After a blistering run, Australia’s rental market is loosening at the edges. Vacancy is edging up off historic lows, rent inflation is set to moderate into 2026, yet underlying demand remains ...Read more

Property
Don’t lose the deposit: A case study in stopping real estate payment fraud — and the ROI for doing it
Deposit redirection scams are quietly eroding buyer savings and agency reputations in Australia’s property market. This case study unpacks how a mid-tier real estate group redesigned its settlement ...Read more
Property
The $12m threshold: Why portfolio value, not property count, now defines Australia’s investor elite
The old yardstick of six properties as shorthand for investment success has been overtaken by a harsher reality: in today’s market, elite status is defined by balance-sheet strength, not asset countRead more

Property
From intuition to instrumentation: How a "two-stakeholder" sales playbook lifted close rates and cut cycle times
High-stakes consumer purchases are increasingly joint decisions. When one partner is under-served, deals stall. This case study follows an Australian real estate group that rebuilt its sales motion ...Read more
Property
Australian property’s quiet pivot: resilience hides a new competitive map
Australia’s housing market remains sturdier than the macro noise suggests, but the sources of resilience have shifted. For operators, the profit pool is migrating from ‘volume at any price’ to ...Read more
Property
Gen Z’s 5% deposit rush: how policy‑driven demand is reshaping Australia’s housing value chain
A government-backed 5% deposit guarantee has triggered a surge in first-home buyer intent among Gen Z, pulling forward demand and resetting competition across banks, brokers and buildersRead more
Property
Cautious bidders, smarter sellers: a Queensland auction case study on repricing risk
Queensland’s auction market has hit a caution cycle as buyers price in higher borrowing costs, global uncertainty and cost-of-living pressure. Clearance softness is forcing agencies to re-engineer ...Read more
Property
Trust, technology and triage: what NSW’s ‘name and shame’ signals for real estate governance
NSW’s latest enforcement action on real estate trust accounts isn’t a one-off embarrassment; it’s a stress test of sector governance. With licences suspended and penalties applied, the message is ...Read more
Property
Vacancy is rising, demand is resilient: A case study in defending yield as Australia’s rental cycle rebalances
After a blistering run, Australia’s rental market is loosening at the edges. Vacancy is edging up off historic lows, rent inflation is set to moderate into 2026, yet underlying demand remains ...Read more
Property
Don’t lose the deposit: A case study in stopping real estate payment fraud — and the ROI for doing it
Deposit redirection scams are quietly eroding buyer savings and agency reputations in Australia’s property market. This case study unpacks how a mid-tier real estate group redesigned its settlement ...Read more
Property
The $12m threshold: Why portfolio value, not property count, now defines Australia’s investor elite
The old yardstick of six properties as shorthand for investment success has been overtaken by a harsher reality: in today’s market, elite status is defined by balance-sheet strength, not asset countRead more
Property
From intuition to instrumentation: How a "two-stakeholder" sales playbook lifted close rates and cut cycle times
High-stakes consumer purchases are increasingly joint decisions. When one partner is under-served, deals stall. This case study follows an Australian real estate group that rebuilt its sales motion ...Read more


